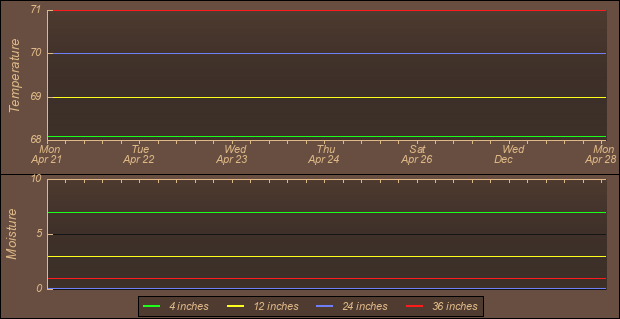
Soil sensors are located in our garden and are buried in the ground
at the levels indicated below. Each level has a temperature probe and a
moisture sensor. Moisture is measured in Centibars (cb) with a range from
0 to 200 where 0 is totally saturated and anything over 100 is considered
extremely dry. The centibar (cb) is an agricultural unit of soil water
tension (water pressure on plant roots).
See this Chart for Details.
The garden is irrigated to support optimal growth during the growing
season therefore moisture conditions will not reflect those around the area.
|
Avg. Air Temp °F |
Rain in. |
| Since Midnight |
63.1° |
0.00 |
| Yesterday |
62.5° |
0.00 |
| Last 7 Days |
64.8° |
0.45 |
| Last 31 Days |
54.7° |
0.00 |
Today's Growing & Watering Status
| Depth |
Temp °F
Now / Hi / Lo |
Temperature Status |
Moisture cb
Now / Hi / Lo |
Moisture Status: |
| 4 in. |
68 / 71 / 68 |
Optimal Shoot Growth |
7 / 8 / 6 |
Saturated Soil |
| 12 in. |
69 / 71 / 69 |
| 3 / 3 / 3 |
Saturated Soil |
| 24 in. |
70 / 71 / 70 |
| 0 / 0 / 0 |
Saturated Soil |
| 36 in. |
71 / 71 / 71 |
| 1 / 1 / 1 |
Saturated Soil |
Leaf Wetness Sensor
0 = Dry 15 = Wet
| Current |
Day's High |
Day's Low |
| 0 |
15 |
0 |
| Wet 0 Minutes in the Last 10 Min. |
| Wet 0 Minutes in the Last Hour |

Rain
| Current |
Inches per Minute |
Inches per Hour |
| Rain Rate |
0.00 |
0.000 |
| Last Storm 0.37 in. beginning on 9/7/2024 |
| Rain Last Sensed at 11:15 AM on 9/7/2024 |
Additional Observations
| Conditions |
Current |
last 7 Days |
Month to Date |
| Evapotranspiration |
0.210 |
1.083 |
0.21 |
| Rainfall |
0.00 |
0.45 |
2.030 |
ET describes the sum of evaporation and plant transpiration
from the surface to the atmosphere. Evaporation is the
movement of water to the air from the soil, canopy interception,
and water bodies. Transpiration is the movement of water within
a plant and the subsequent loss of water as vapour through
stomata in its leaves.
Irrigation Index1
| Current |
last 7 days |
Month to Date |
| -0.21 in. |
-0.633 in. |
1.82 in. |
1Estimated amount of water needed to replace the water used by
plants and evaporation. (Negative numbers mean amount of water
needed, positive numbers mean excess water is present).
The 7-Days Irrigation Index of
-0.633 in. is a very useful and
accurate guide used to determine how much water is needed to
maintain your plants. It is derived by taking the last 7 days
of rainfall 0.45 in.
minus the last 7-Days of ET 1.083 in. ,
as measured by Ammenheuser Weather. The index represents the
amount of water needed to replace that lost by ET over the
last week. (A positive 7-Day Index means excess water is present).

 View South
 View West